Within the dynamic world of financial markets, traders and investors share the same goal: to achieve sustainable and consistent profits. Achieving this goal requires great knowledge and skills to anticipate market cycles and make accurate predictions. Among the many techniques used by professional traders, candlestick patterns stand out as a prominent tool in technical analysis. This article will explore candlestick patterns and their role in accomplishing profitable trading results.
Originating in 18th-century Japan, candlestick patterns are graphical representations of price movements in financial markets. These patterns are portrayed as a sequence of bars or “candles” on a price chart, providing valuable insights into the sentiments of market participants.
Each candlestick consists of a body and wicks, and its color signifies whether prices have risen or fallen during a specific period. Traders employ the analysis of these patterns to forecast future price changes, aiming to anticipate trend reversals or continuations.
Table of Contents
Are Candlestick Patterns the Holy Grail of Trading?
Candlestick patterns are valuable tools for predicting market prices with a high degree of accuracy, but they are not the holy grail of trading. The reliability of these patterns depends upon various factors, including the timeframe under consideration, the specific market being analyzed, and the overall market context. Furthermore, external influences such as significant political events can impact the accuracy of these patterns.
To mitigate the risk of false signals and market noise, it is advisable to supplement candlestick patterns with additional technical analysis tools. Combining them with trend lines, support and resistance levels, as well as other technical indicators, can yield more reliable results.
Most Common Candlestick Patterns
Doji Candlestick Pattern
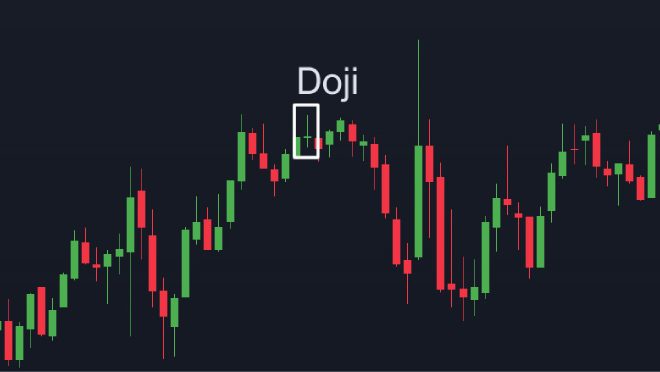
A doji forms when the opening and closing prices are almost the same. It has a small or no body, and it shows market indecision or balance between buyers and sellers. Upper and lower wicks can vary. In this scenario, traders are waiting for the next candlestick patterns for a break to the upside or downside.

Engulfing Candlestick Pattern
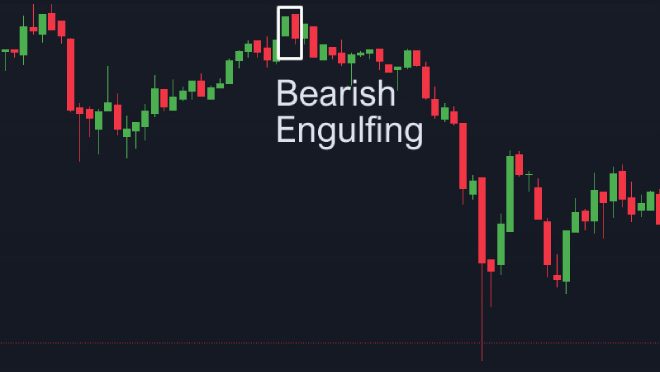
Engulfing consists of two candles. The second candle’s body completely engulfs the first candle’s body. There are two types of engulfing candlesticks: bullish and bearish. Bullish engulfing forms when a small bearish candle is followed by a larger bullish one. It suggests a bullish reversal, and therefore, traders look for buying opportunities in the market.


Bearish engulfing happens when a small bullish candle is followed by a larger bearish one, indicating a bearish reversal and shorting opportunities.
Hammer Candlestick Pattern
A hammer has a small body near the top and a long lower wick, like a hammer. It’s very accurate when it appears in a downtrend that was developed for a longer period of time and indicates a potential reversal.


The long lower wick shows sellers pushed the price down, but buyers entered and pushed it back up, forming strong support. Traders interpret a hammer as a bullish sign, showing buyers gaining strength and the downtrend possibly ending.
Evening Star Candlestick Pattern
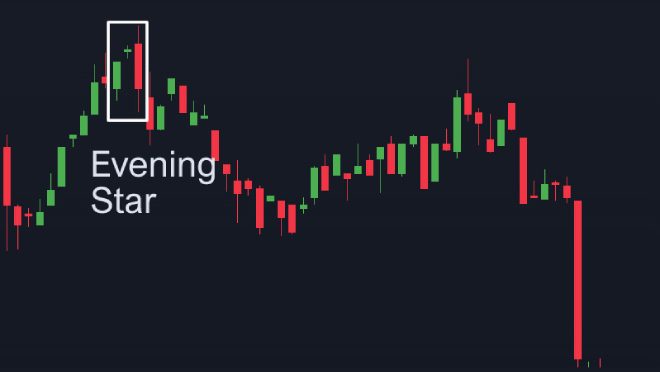
The Evening Star pattern is the most reliable when it forms after a longer development of an uptrend. It consists of three candles:


- The first candlestick is a bullish one.
- The second one is a small candle, either bullish or bearish, that forms close to the close price of the previous candlestick.
- The third candlestick is a larger bearish candle that needs to have a body at least the same or bigger than the first candlestick.
This pattern indicates a possible shift from bullish to bearish. It shows that buying pressure is decreasing, and selling pressure might rise. Traders view the evening star as a strong signal to sell.
How to Increase Accuracy of Candlestick Patterns
Combine with other technical indicators: To improve accuracy, consider adding extra confirmation signals in your strategy using other technical indicators such as RSI, Bollinger Bands, or Moving Averages. There are hundreds of free indicators out there. You can explore them on platforms like TradingView.
Use higher time frames: Compared to smaller time frames, analyzing candlestick patterns on higher time frames, such as daily or weekly charts, can produce more accurate signals. Higher time frames provide a better market perspective by filtering out certain noise.
Consider the context: Don’t solely focus on the candlestick pattern itself; take into account the surrounding market context. Analyze support and resistance levels, trend direction, and market sentiment to assess whether the candlestick pattern aligns with the overall market conditions.
Consider the surrounding market context in addition to the candlestick patterns themselves. To determine whether a candlestick pattern corresponds with the general market conditions, analyze support and resistance levels, trend direction, and market sentiment. For example, would you consider following the signal of a bullish engulfing pattern that forms when all other technical indicators suggest that the trend is still “strong bearish”? Probably not…
Validate patterns with volume: Volume can provide additional confirmation for candlestick patterns. Look for increased volume during the formation of a pattern to improve the accuracy of your trades.
Backtest and verify: Before relying on candlestick patterns, conduct thorough backtesting on historical data to evaluate their effectiveness. This process will help you determine which patterns work well in specific market conditions and validate their accuracy.
Verify and backtest: Before throwing your hard-earned money on candlestick patterns, take enough time to analyze their accuracy on historical data. This way, you will find out which ones perform best under particular market situations and which markets and timeframes you should focus on to maximize your returns.
To protect yourself against significant losses, use appropriate risk management strategies like stop-loss orders and position sizing. Since no pattern is 100% correct, it’s critical to manage risk appropriately. Most beginner traders lose their funds in just a few trades because of poor risk management.
Final Words
In conclusion, candlestick patterns are valuable tools in trading, but they are not foolproof. To increase accuracy and gain an edge in the markets, combine them with other indicators, consider higher time frames and market context, filter fake signals with volume, and conduct thorough backtesting. Also, implement proper risk management strategies to avoid losing all your funds from just a few mistakes.
May the markets be with you!


